Create a discovery service using kdb+ 🔍

First things first, the code for this blog can be found here.
A discovery service can be a very nice piece of kit in your infrastructure.
Having some central application that maintains information about every service in your application estate can be extremely beneficial to developers and the business.
Interacting with this service means it’s easy to obtain location details of other services, their health state, their kdb+ version etc.
So without further ado, this blog will build a in-house discovery service in
kdb+using an asynchronous heartbeat model
The plan⌗
All clients will load in some client library (.client namespace) on start-up.
Each client calls a function .master.storeHb to be remotely executed on a master process asynchronously.
This function will upsert a record to a table .master.discovery.
This table will keep track of all heartbeats and services. It will serve as the golden source of truth.
The .master.discovery table contains an active column. If the service is regularly publishing updates, then this service is marked as active 🟢 in .master.discovery.
If the master process doesn’t receive an update from a service within some set interval, it will be marked as inactive 🔴.
The port open/port closed (.z.po / .z.pc) event handlers will be overwritten with a connect/disconnect function that will update some internal tables upon execution.
We will also create some HTML/js dashboard that will interact with the discovery service via websockets. It will make it easier to eyeball which processes are in our application estate and their health 📊.
The code⌗
I’m not going to bore you and deep-dive into the logic, instead I’ll extract snippets which I deem important.
The code within the repo should be adequately commented and can be easily followed by walking through the demo explained in the README.
master.storeHB:
\d .master
...
storeHb:{
    if[not[null expiredH] and not .z.w~expiredH:.master.discovery[x`process;`handle];
       `.master.discovery upsert @[;`active;:;0b] @[;`time;:;time] exec from status where handle=expiredH;
       @[hclose;expiredH;()]];
    payload:(x`process;.z.w;x`ip;x`address;x`pid;x`counter;x`lastHb;1b;0b;0b);
    upsert[`.master.discovery;payload]
 }
-
This function is executed on the master discovery service.
-
It is called (asynchronously) by each client who has elected to publish heartbeats.
-
It upserts a payload to the table
.master.discovery. -
.master.discoverylooks like:
q)h:hopen 9090
q)h".master.discovery"
process   | handle ip        address                        pid   counter lastHb       active warning error
----------| -----------------------------------------------------------------------------------------------
milg_94267| 8      127.0.0.1 :jamess-macbook-pro.local:8002 94267 118     15:16:46.230 1      0       0
milg_94269| 9      127.0.0.1 :jamess-macbook-pro.local:8004 94269 118     15:16:45.132 1      0       0
milg_94270| 10     127.0.0.1 :jamess-macbook-pro.local:8005 94270 118     15:16:45.640 1      0       0
milg_94268| 11     127.0.0.1 :jamess-macbook-pro.local:8003 94268 118     15:16:45.538 1      0       0
milg_94271| 12     127.0.0.1 :jamess-macbook-pro.local:8006 94271 118     15:16:45.380 1      0       0
milg_94266| 13     127.0.0.1 :jamess-macbook-pro.local:8001 94266 118     15:16:45.581 1      0       0
milg_94272| 14     127.0.0.1 :jamess-macbook-pro.local:8007 94272 118     15:16:45.931 1      0       0
☝️ The process name in the above table is set to be an arbitrary value in this example… this would normally be set to be an actual service for .e.g rdb, rts and hdb.
.client.publish:
\d .client
...
publish:{
  payload:`process`ip`address`pid`qVersion`counter`lastHb!(proc;`$"."sv string "i"$0x00 vs .z.a;`$":",(string .z.h),":",string system"p";.z.i;`$"v" sv string .z.K,.z.k;counter;.z.t);
  .log.info["Publishing heartbeat to master server"];
  neg[hdl](`.master.storeHb;payload);
  counter+::1
 };
-
This is the publish function executed on a timer by each client.
-
It asynchronously executes the function
.master.storeHbwith a payload of the form:
process | `milg_11460
ip      | `127.0.0.1
address | `:macbook.local:8084
pid     | 11460i
qVersion| `4v2021.07.12
counter | 125
lastHb  | 15:21:17.287
- It increments the heartbeat counter by 1 each time.
.client.connect:
\d .client
...
connect:{
  conn:`;
  if[not `.cfg.discovery.handle ~ key[`.cfg.discovery.handle];
     .log.error"No discovery handle specified in config file"
  ];
  h:@[hopen;(.cfg.discovery.handle;1000);{.log.warn"Disconnected from discovery service";: 0Ni}];
  if[not null h;.log.info"Connected to discovery";hdl::h];
 };
-
This is the connect function executed by each client.
-
It will check for the existance of a handle defined by
.cfg.discovery.handle. If this exists, it will attempt to connect to the discovery master server. -
The handle to the discovery service is stored in the variable
.discovery.hdl. If the cliuent cannot connect to the discovery service (for e.g. if the master server is down),.discovery.hdlwill be set as a null0Ni. -
Note:
.cfg.discovery.handlegets defined in the init code during startup.
.client.run:
\d .client

...
run:{
  if[(null hdl)|(not hdl in key[.z.W]);
     .log.warn"Attempting reconnection to discovery";
     connect[]
  ];
  if[sendHB and not null hdl;
     publish[]
  ]
 };
- This function is executed as a cron job on the client.
//Execute every 2 seconds
.cron.add[`funcName`inputs`nextRun`interval`repeat!(`.client.run;`;.z.P+00:00:01;2;1b)];
-
It will first check that the handle to the discovery master server is valid. If the handle is null, it executes
client.connect[]to retry connecting to discovery. -
If the handle is valid and
.client.sendHBis set to true (1b), it will execute.client.publish[]to send heartbeats to the discovery service.
A frontend dashboard 💻⌗
Although, it’s probably preferable to query for service details over a handle … why not create a fancy dashboard which will do all this for us?
Clicking a few buttons 🔲 on this dashboard will allow us to subscribe to all/or a set of services and continually receive updates for these processes!
This dashboard will connect to the discovery service and will display the table .master.discovery, as shown below:
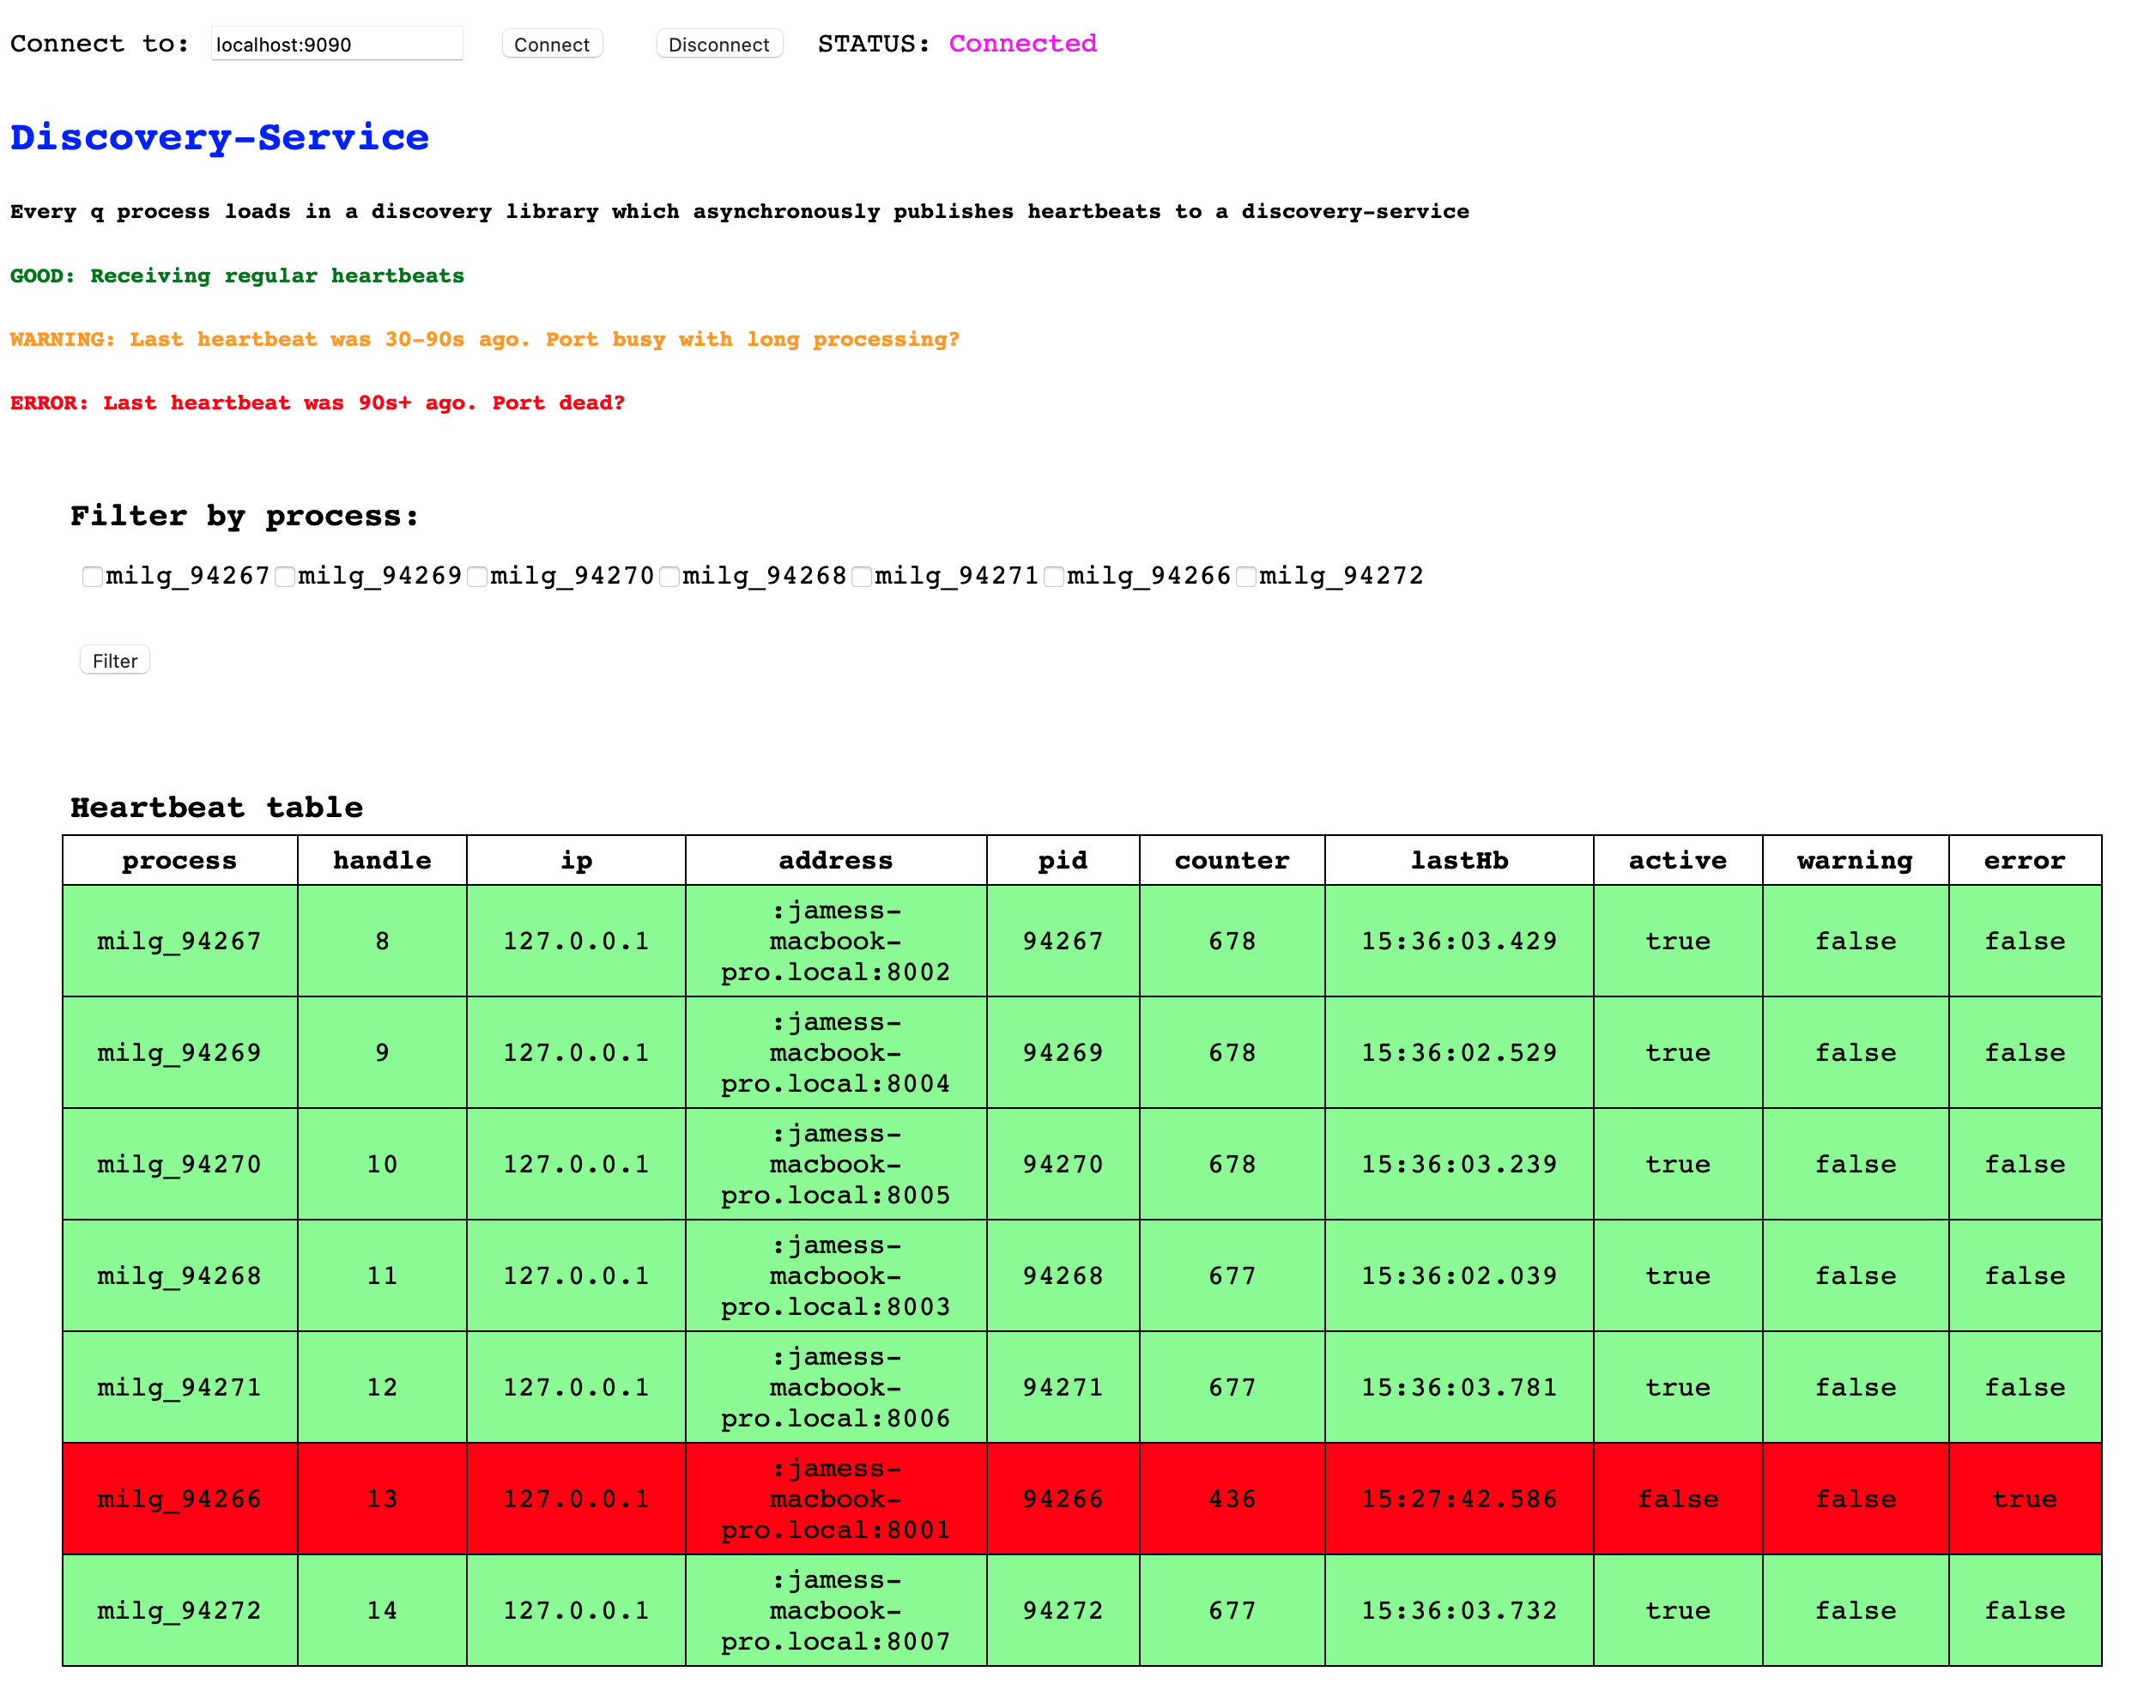
The discovery service will publish updates to this dashboard via .master.pub which is called inside .master.run (executed as a cron job):
\d .master

...
/ publish data according to subs table
pub:{
  row:(0!subs)[x];
  (neg row[`handle]) .j.j (value row[`func])[row[`params]]
 };
/ run every 2 seconds
.cron.add[`funcName`inputs`nextRun`interval`repeat!(`.master.run;`;.z.P+00:00:01;2;1b)];
-
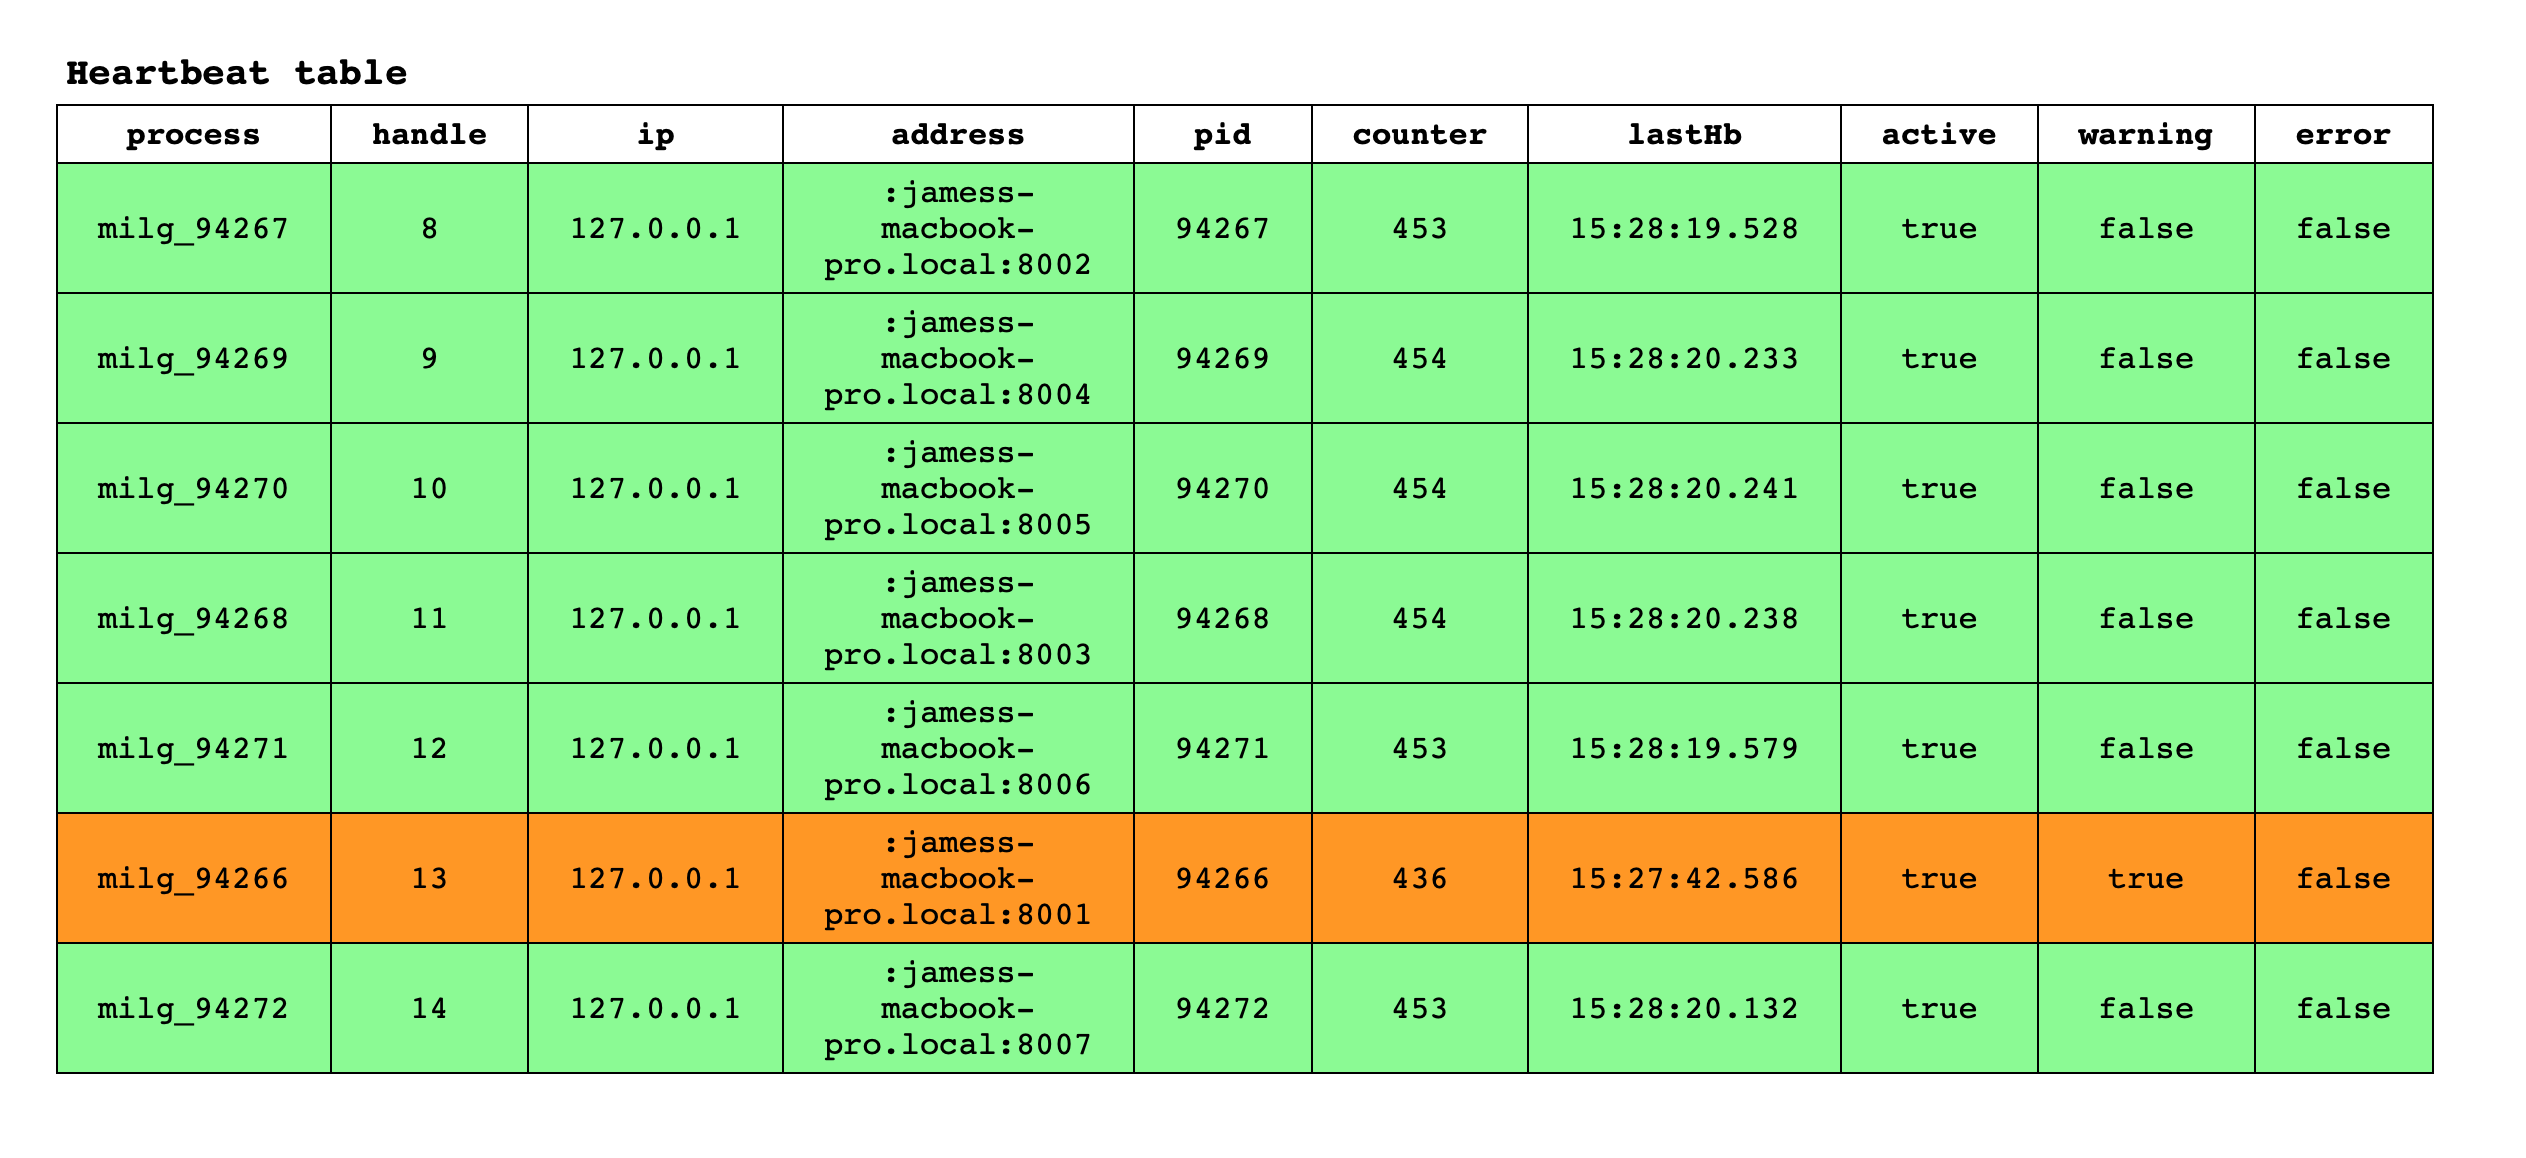
If a service hasn’t received an update in the last 30 seconds, its row will change to 🟧 in the dashboard:
-
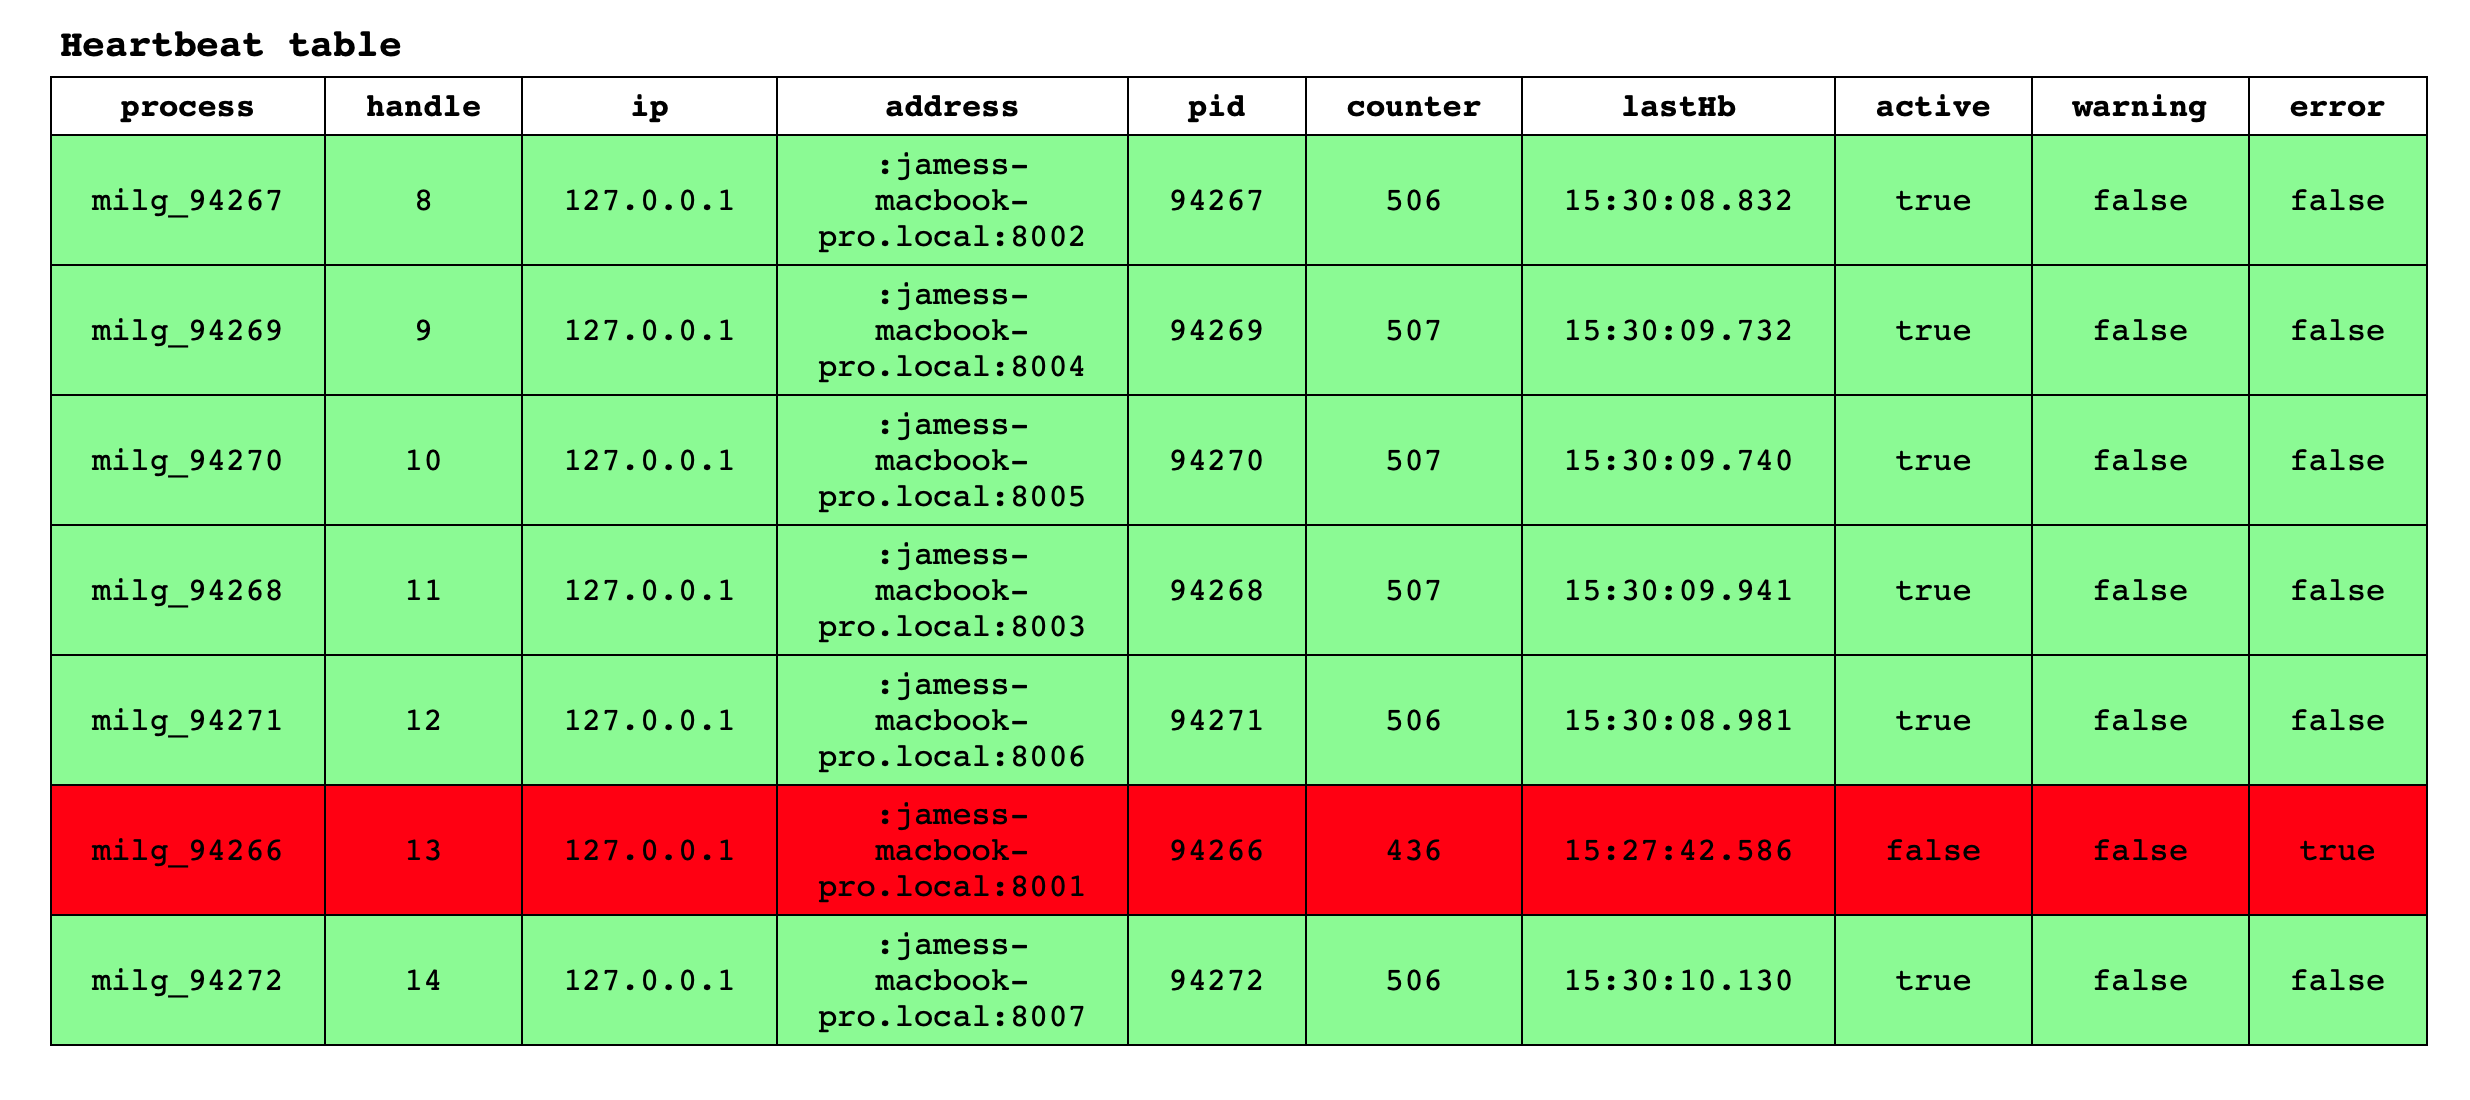
If a service hasn’t received an update in the last 90 seconds, it will change to 🟥 !
Bingo, we’ve created a simple in-house discovery service
Going forward, we can create some stored procedures and lock down what can be executed and who can see what within the discovery service.
Now, I’m not saying this is a replacement for
Consulorprometheusper say, but if your budget is tight, why not create an in-house service?